Talk to us

Tell us what you are trying to find out

A building you are unsure about, a lease decision coming, or a question about how any of this works. We will come back to you.

Thank you, that has reached us

It has reached us and one of us will reply to the address you gave. If it is urgent, email the contact form above.

{{ cError }}

{{ cSendLabel }} Or email the contact form above
Workplace utilisation · since {{ nSince }}

How your offices are actually used

Surveyors walk your floors on a tablet several times a day and record what every desk, meeting room and breakout space is doing. It becomes a live report, drawn onto your own floor plans.

Get a quote → Coming soon
Or open a real report first →
{{ slide.caption }}
{{ slideCaption }}
{{ nStudies }}studies {{ nReadings }}readings {{ nBuildings }}buildings {{ nCountries }}countries {{ nSectors }}sectors {{ nSince }}observing since

Perception and reality rarely match.

Ask the floor and the building is full. No rooms free, people perched on sofas, time to take another lease. Measure it and the same floor looks like this.

Reality: measured {{ realityPct }} of the working day, across {{ nStudies }} studies. Rooms sitting empty.
Perception: what it feels like {{ perceivedPct }} Nowhere to sit. No rooms free. Time to take another floor.
↔

A desk that is occupied, a desk with a coat on the chair, and a desk nobody has touched all week are three different findings. The report separates them.

Split by workstation and space type, by day, by time of day, by department. Floor plans come from CAD, or straight from a clear PDF or image. No CAD needed at your end.

Reports come in twelve languages, in UK or US spelling. Everything exports: PDF print packs, and the raw readings.

What comes back

Utilisation, occupancy and signs of life, split by group and by time. Written findings sit alongside the figures, and a benchmark of {{ nStudies }} studies across {{ nSectors }} sectors gives every number something to be read against.

Survey days10 Readings taken27,800 Locations surveyed348 Peak personnel179

Figures from the demo study. Open the demo report → to move around it yourself.

Get a quote for your building →
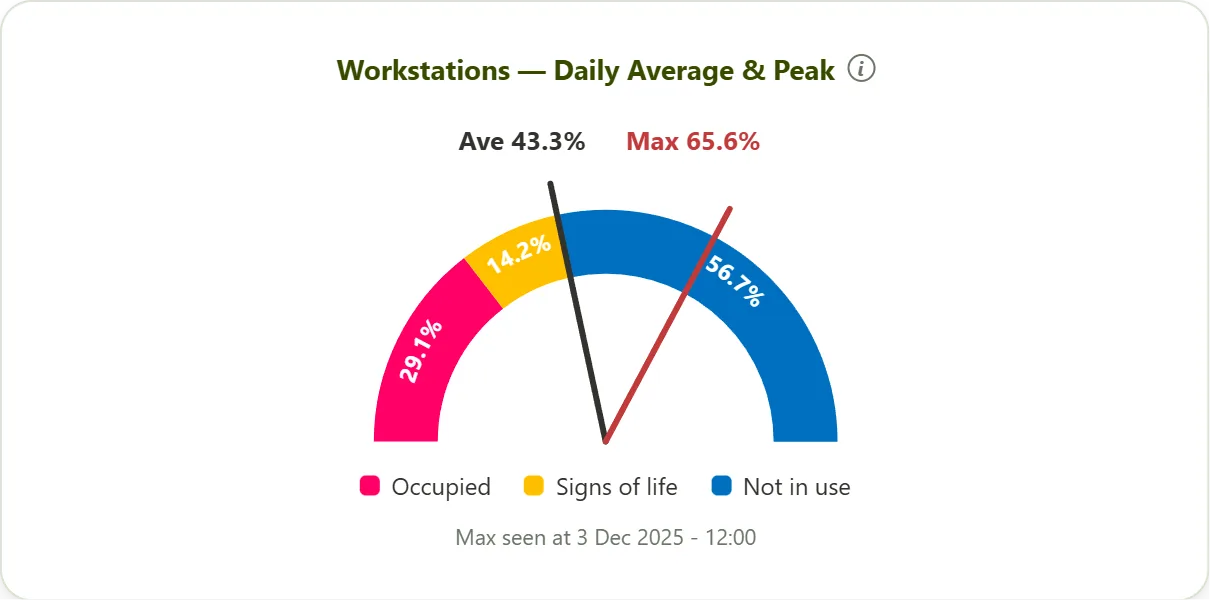
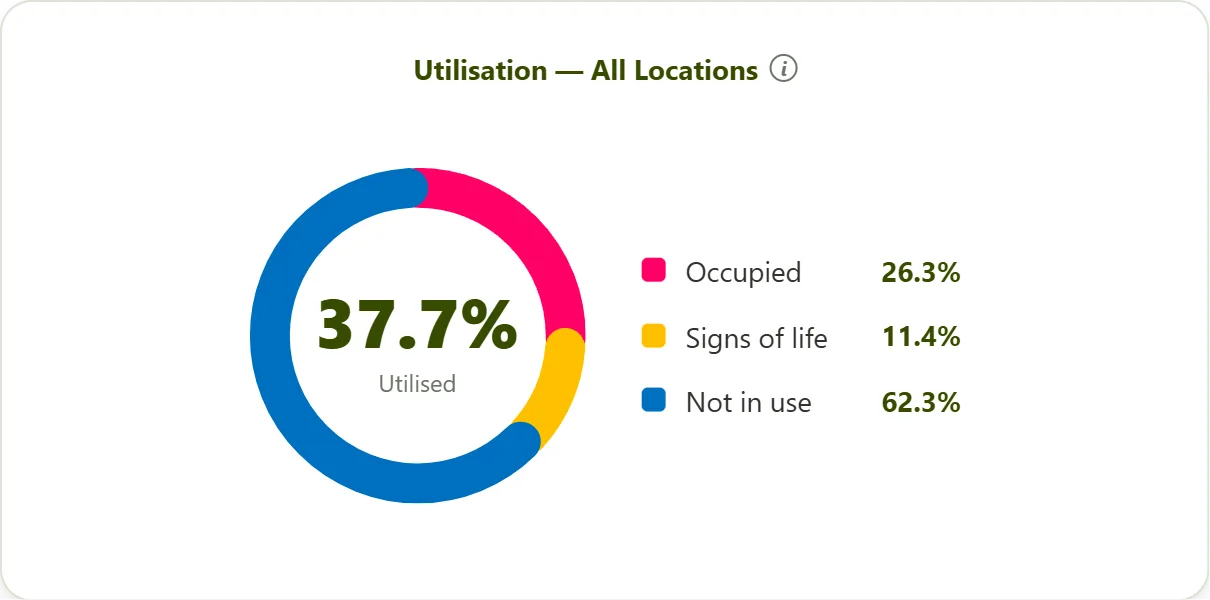
Utilisation across all locations Workstations, daily average and peak
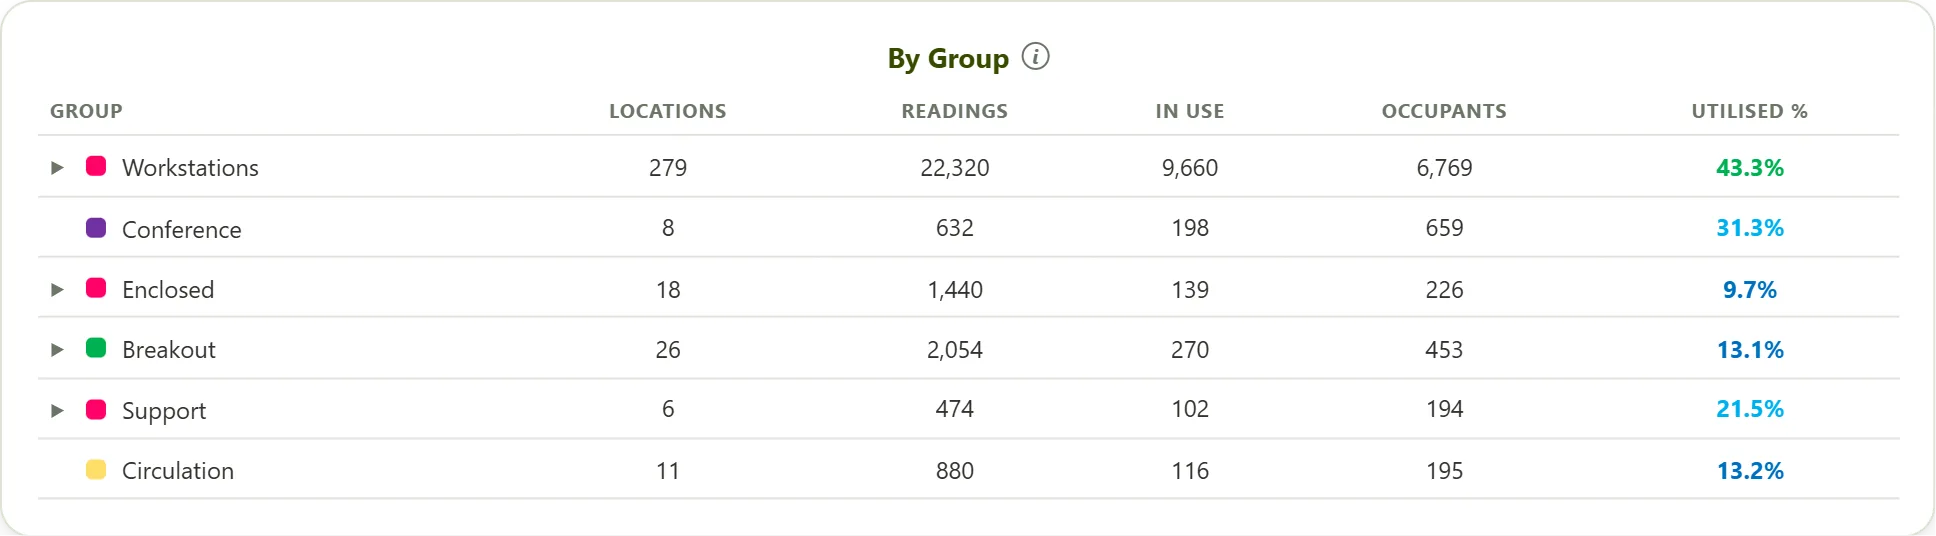
Utilisation by group
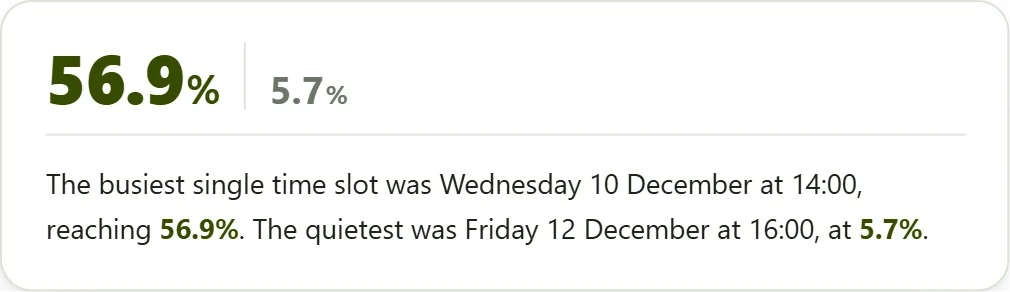
Busiest and quietest time slots A written finding from the report

How a study runs

The report builds while the survey is still on the floor. Nothing waits for the end.

Talk to us about yours →
01 Survey Surveyors walk the floors several rounds a day, for as long as the study runs. The tablet app works offline and speaks their own language.
02 Live report Readings land in the report as they are taken, mapped onto the plans and split by space type, day, time of day and department.
03 Findings Written analysis is added beside the numbers, with the benchmark for context where you have access to it.
04 Export PDF print packs for circulation, and the raw readings if your team wants to work with the data themselves.
On the App Store and Google Play Your surveyors install it the way they install anything else. Nothing to sideload, no MDM profile, no IT ticket. Updates arrive on their own mid-study.

What the benchmark says

{{ nStudies }} studies · {{ nSectors }} sectors · {{ nCountries }} countries

Every figure here is the average across the whole benchmark. The value is in the cuts of it: your sector, your city, your days of the week. Those come with a study.

See the whole benchmark →
Workstations, before Covid
{{ tWsPre }}
Workstations, since
{{ tWsPost }}
of the working day, on average
Everything else, since
{{ tOtherPost }}
meeting rooms, breakout, the rest of the floor
{{ row.label }} {{ row.pct }}

Averaged across core hours. Broken down by sector, region, day and time of day for clients with benchmarking on their plan.

One building or twenty

Tell us about your building.
We will tell you what it costs.

DIY is self-serve and priced per location. Report, Report & Control and Your Own Observe are quoted per engagement. A few questions about the building and we will come back with a number.

Get a quote → Compare the four packages
Running one yourself, from £250, is coming soon.

Four ways to run a study

The platform is the same in all four. What changes is who does the fieldwork, who holds the controls, and whose name is on the report.

Report

We run the whole study. You read the results.

Quoted per engagement

Adept plan the study, draw the floor plans, put surveyors on the floors and write the findings. You get a live report while the survey is still running, and a print pack at the end.

Plans from CAD, PDF or an image Twelve languages, UK or US spelling Written findings alongside the numbers PDF print packs and raw readings

Report & Control

We set it up. You hold the controls.

Quoted per engagement

The same study, with the report in your hands. Set your own branding and terminology, decide how spaces are allocated to departments, and share it with whoever you like without coming back to us.

Your logo, colours and wording throughout Control of allocations and classifications Your own wording, and the report language Share internally without coming back to us

Your Own Observe

For consultancies: run studies for your own clients.

Annual licence, quoted

The platform as your own product. Your brand, your terminology, your surveyors, unlimited studies for the term of the licence. Adept stay out of the client relationship.

Unlimited studies and locations Fully branded reports and tablet app Tablet app in your surveyors' languages Benchmark access available as an extra

DIY

Survey your own offices, self-serve.

Priced per location, report included See the price ladder

Any company can run its own study. Upload or draw your plans, mark up the locations, send your own people out with the tablet app, and the report builds itself as the readings come in.

Banded pricing, the rate improves as you go Report included in the price of the study Own branding and terminology as an extra Benchmark access available as an extra

Where they differ

Report

Adept run the study end to end and hand you the results.

SurveyingAdept
Setting upAdept
Findings written byAdept
BrandingAdept’s
Floor plansCAD, PDF or image
StudiesOne engagement
BenchmarkIncluded
Price Talk to us
Talk to us

Report & Control

We do the fieldwork; the report is yours to shape and share.

SurveyingAdept
Setting upAdept
Findings written byAdept, edited by you
BrandingYours
Floor plansCAD, PDF or image
StudiesOne engagement
BenchmarkIncluded
Price Talk to us
Talk to us

Your Own Observe

Run the whole platform under your own name.

SurveyingYour surveyors
Setting upYou
Findings written byYou
BrandingYours, throughout
Floor plansCAD, PDF or image
StudiesUnlimited for the term
BenchmarkOptional extra
Price Annual licence
Talk to us

DIY

Your own people survey your own offices, self-serve.

SurveyingYour own staff
Setting upYou
Findings written byYou
BrandingOptional extra
Floor plansPDF or image only
StudiesPer study, per location
BenchmarkOptional extra
Price From £250 a study Before VAT
See the price ladder
The same in all four
Plans from a PDF or an image Tablet app on the App Store and Google Play, offline, in the surveyor’s language Live report, building as the survey runs Reports in twelve languages, UK or US spelling Heatmaps drawn onto your own floor plans PDF print packs and the raw readings

Priced per location, banded like tax

A £250 minimum covers your first 250 locations, whether you survey 20 or 249, and the rate improves as the study grows beyond it. A 900-location study is the £250 minimum, then 90p for the next 250 and 80p for the rest. £795 in total, before VAT.

Locations Rate A study that size
Up to 250 £250 minimum fee £250
251–500 £0.90 £475
501–1,000 £0.80 £875
1,001–2,500 £0.70 £1,925
2,501–5,000 £0.60 £3,425
5,001+ £0.50 £5,925 at 10,000

You don't have to guess your size. The £250 minimum opens your study; build your floors, and when you start surveying we count the locations you actually drew and bill only the bands above 250. Plan for 250, end up at 276, and the difference is £23.40, taken before surveying begins.

Per study, report included. Prices exclude VAT. UK customers pay VAT at 20%; outside the UK it depends where your business is based. A location is anything surveyed: a desk, a meeting room, a breakout area, a phone booth.

Your own branding Optional extra
Your logo, colours and the words your organisation uses for its spaces.
Benchmark access Optional extra
{{ nStudies }} studies across {{ nSectors }} sectors and {{ nCountries }} countries, going back to 2013.
Work out a study locations surveyed
{{ row.label }} {{ row.value }}
Optional extras
Total for the studyExcludes VAT. 20% for UK customers {{ total }}{{ extrasNote }}
Coming soon

Report, Report & Control and Your Own Observe are quoted per engagement. See the packages.

Workplace utilisation benchmark

How workplaces are really used.

Observed, not sensed: every number began with a surveyor walking a floor and recording what they saw. No sensors, no swipe cards, no estimates, across {{ nBuildings }} buildings since {{ nSince }}. All data is fully anonymous.

{{ tHeadline }}

average utilisation of every place Adept has observed, the grand total for the whole benchmark

{{ nStudies }}studies{{ nReadings }}readings{{ nCountries }}countries{{ nSectors }}sectors{{ nBuildings }}buildings{{ nSince }}observing since

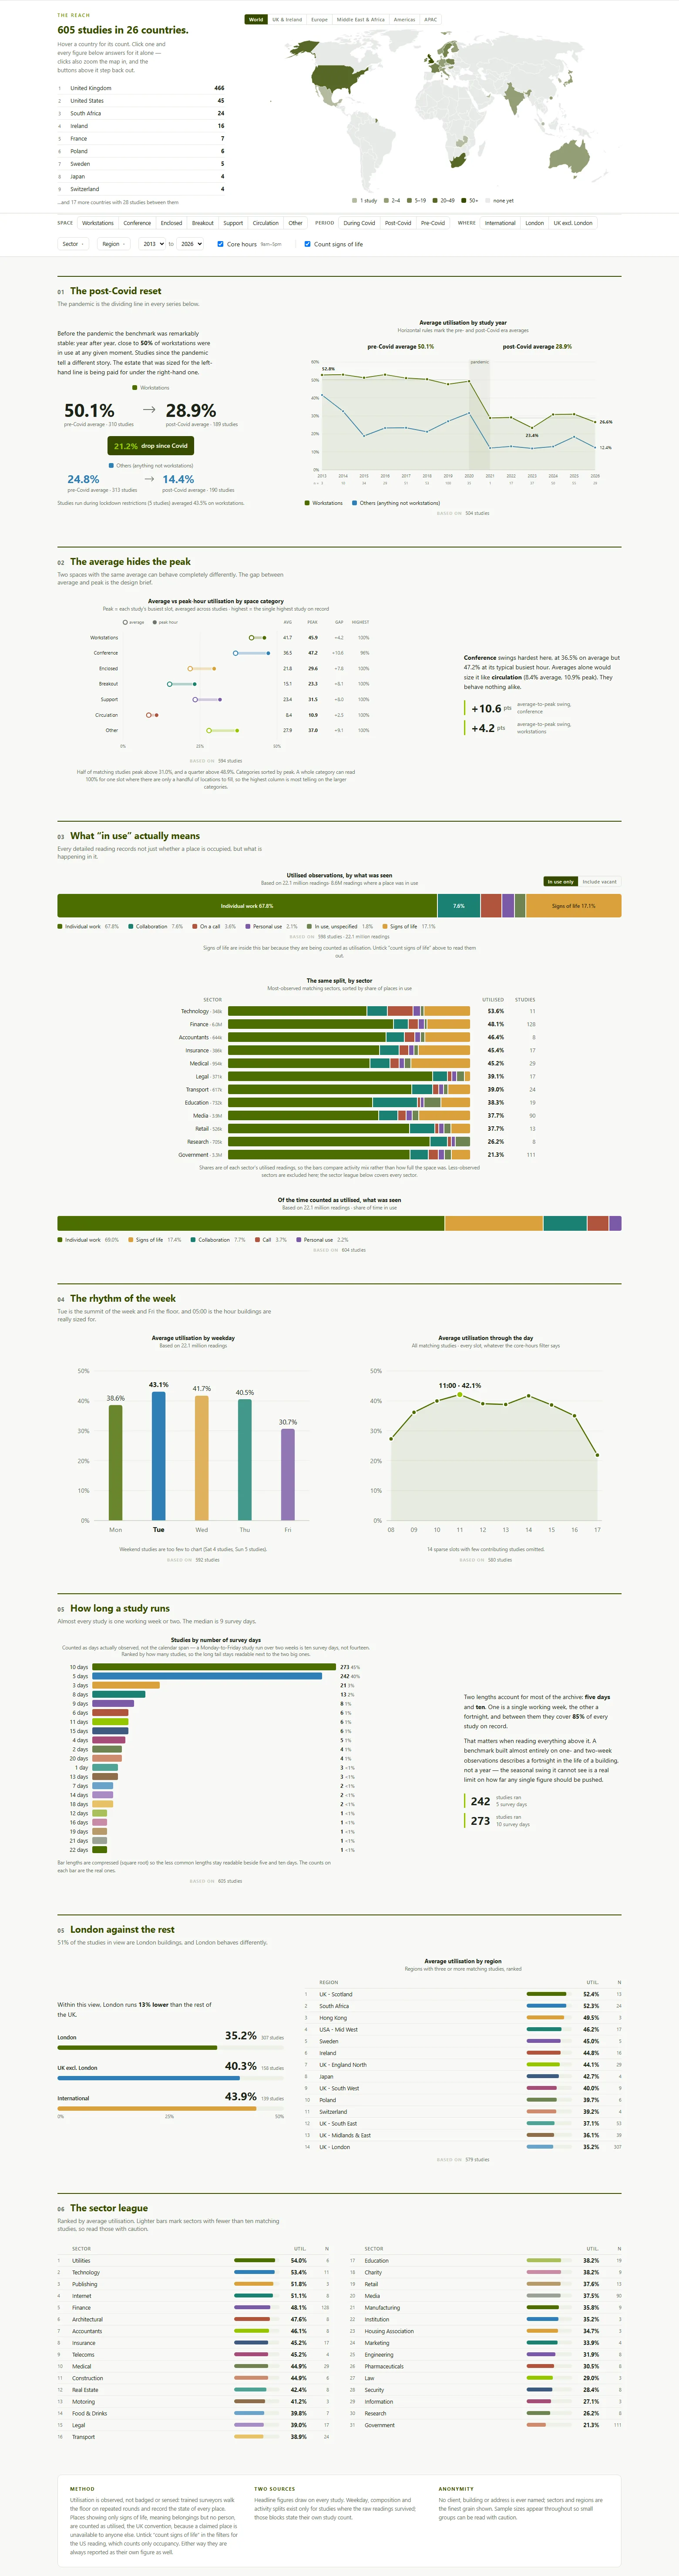
The overview, exactly as clients see it

The real page, not a mock-up
adeptobserve.com · Benchmarking
The Adept Observe benchmarking overview page

The rest of the benchmark

The Overview above is the whole benchmark averaged together. Clients with benchmarking on their plan filter all of it by sector, region, year, day and time of day, and get these sections as well.

03The average hides the peak

What a building actually has to hold on its busiest hour, against what it averages.

04The rhythm of the week

Which days carry the building, hour by hour. Rarely the ones people assume.

05London against the rest

Regional and international comparison, down to your own city.

06The sector league

How your sector compares with the other 44, and which of them run their space hardest.

See the packages Open the demo report

Signs of life counted as use, era comparisons across core hours, the same settings the report itself opens on. Studies are anonymised: no client is identifiable from the benchmark, including yours once you are in it.

Set up your account

Three steps. Add floor plans and locations once you are in; nothing is charged until you start a study.

1 Email
2 Organisation
3 Payment

Your work email

We send a confirmation link. Use a work address. It becomes the owner of the account.

Continue

Your organisation

Back Continue to payment

Payment

You are charged per study when you start one, at the banded rate, plus VAT at 20% if you are a UK business. Nothing is taken today.

Back Create account

Account created

Check your inbox for the confirmation link. Next: upload a floor plan, a PDF or an image, and mark up the locations you want surveyed. Need it drawn from CAD? Talk to us.

Start again